Gaze heatmaps
See where visitors look inside every 360° scene, second by second, and what catches the eye in the first three seconds.
PANORA Analytics turns every 360° tour into a detailed dashboard: where visitors look, the routes they take, what they click and how long they stay. One line of code is all it takes.
 Play MAMIE audio131Go to Dwight D. Eisenhower …115Go to Dwight D. Eisenhower …109
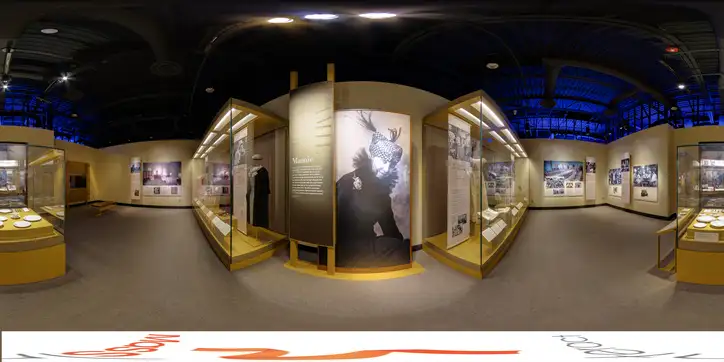
Live demo: a gallery at the Eisenhower Presidential Library. The glow shows where visitors looked; the pins are hotspots with their clicks.
No tagging, no event plans, no developer. The tracker reads the tour itself and maps every scene, hotspot, menu and video on its own.
<script src="https://panora-analytics.vercel.app/t.js" data-key="pk_your_tour_key" defer></script>Create an account, name the tour and choose its dashboard address.
Copy your script tag into the published tour and upload it as usual.
Open the tour once. Scenes and hotspots appear, and every visit after that is counted.
Website analytics stop at the page view. PANORA Analytics goes inside the tour, into every scene and every click.
See where visitors look inside every 360° scene, second by second, and what catches the eye in the first three seconds.
The routes people take from scene to scene, where they enter, and the exact scene where visits end.
Views, reach and time spent in every scene, ranked, so you know which spaces sell and which get skipped.
Every hotspot, menu button, thumbnail and outbound link, with how many visitors used each one.
Plays and completion for videos and narration: how many reached 25%, half way and the end.
Countries, cities, languages, devices, browsers and VR headsets, plus new versus returning visitors.
Google, social, direct, embeds on other sites, QR codes and UTM campaigns, each reported on its own.
Who is inside the tour right now, plus the busiest hours and weekdays to plan campaigns around.
Count booking and contact clicks with one call, and see how often visitors share the tour.
Every tour gets its own address, like panora-analytics.vercel.app/your-tour. Send it to your client and they see the results without creating an account.
Panora captures real places in 360° and builds them into experiences people can explore: for universities, hospitals, hotels, malls and developers. PANORA Analytics is the tool we built to show our clients what happens inside those tours, and now it is available for yours.
Visit panora.com.pk →Create an account, paste one line, and see your first visitors today.