AnalyticsYour dashboard

Sage Pine Avenue

SAGEsage.edu.pk/
24h7 days30 days90 days12 months
OverviewVisitorsScenesJourneysClicks & media

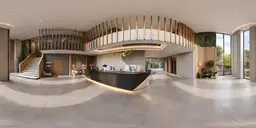
All scenes

Library

18
views
7s
average time here
6%
of views ended the visit
LessMore time looking

Go to Building entrance 21
BehindLeftStarting viewRightBehind

Brighter areas got more viewing time. Dots are hotspots: green ones go to another scene, amber ones open media or links; the number is clicks in this period. In the first three seconds, 10% of looking stays near the starting view.

Hotspots in this scene

Clicks and the share of views that clicked

HotspotTypeClicksVisitsClicks per view
Go to Building entrance 2Go to scene116%

How long people stay

  • 0–5s11
  • 5–15s4
  • 15–30s2
  • 30–60s1

How they got here

  • Tour menu8
  • Scene list / thumbnails7
  • Automatic or other3

Came from

  • IT Lab8
  • Main Reception4
  • Scene EBA5A89E1
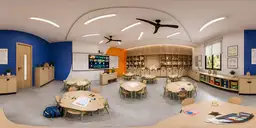
  • Junior School Classroom1
  • Parents Community Center1
  • Reception Lounge1
Analytics by PANORA Analytics, a product of Panora Virtual Tours (Private) Limited.Get analytics for your tour
  • outdoor cafe1
  • Kids Play Area1
  • Went next

    • Main Reception6
    • Auditorium4
    • TBH Cafe2
    • IT Lab2
    • Science Lab1
    • Senior School Classroom1
    • Building entrance 21