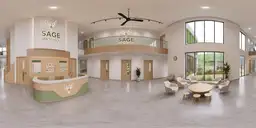
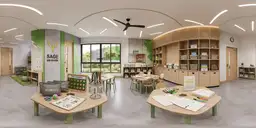
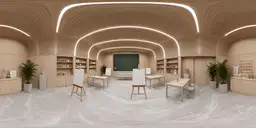
Speech Therapy Room
9
views
7s
average time here
11%
of views ended the visit
LessMore time looking
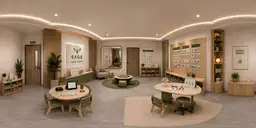 Go to SEN Lobby3
Brighter areas got more viewing time. Dots are hotspots: green ones go to another scene, amber ones open media or links; the number is clicks in this period. In the first three seconds, 70% of looking stays near the starting view.
Hotspots in this scene
Clicks and the share of views that clicked
| Hotspot | Type | Clicks | Visits | Clicks per view |
|---|---|---|---|---|
| Go to SEN Lobby | Go to scene | 3 | 3 | 33% |